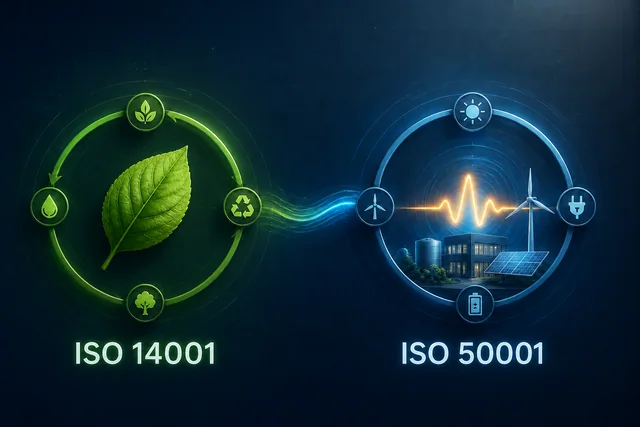
Test news item: from measuring energy consumption to clear actions
A test post to check the production CMS. Using a clear example, it demonstrates how an editor presents baseline data, possible measures and energy consumption monitoring. It does not describe an actual project or the savings achieved.
Test post. This news item demonstrates the content capabilities of a production CMS. The text, table and attachment are provided as illustrative examples; they do not represent an actual project or quantified savings.
From data to a clear decision
An overview of energy consumption is useful when the data is clear and comparable. First, let’s define the starting point, then we write down the questions and only then do we select the measures. More information is available on the page News.
The three steps of the review
We collect data on consumption and the measurement period.
Let us identify changes in the use of spaces and the operation of systems.
For each proposal, we determine how we will verify the result.

An example of clear writing
A good report clearly distinguishes between observations, proposals and the method of assessing impact.
Let us describe the starting point.
We select a measure for further assessment.
Let’s agree to review the data again.
The following table shows example of a structure, rather than actual results:
Step | Question | Exit |
|---|---|---|
Overview | What information is available? | List of sources |
Assessment | What is worth checking? | Proposed measures |
Monitoring | How do we compare the situation? | Measurement plan |
Display of data and additional sources
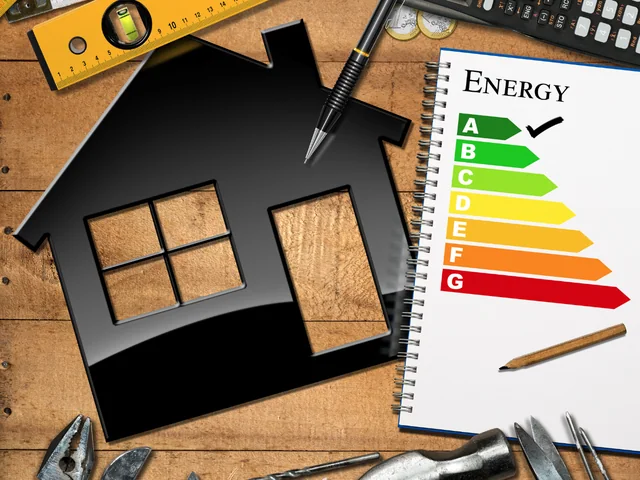
The gallery below shows how images can complement the text. The two images are examples of data visualisation and educational content; they are not the result of this test article.
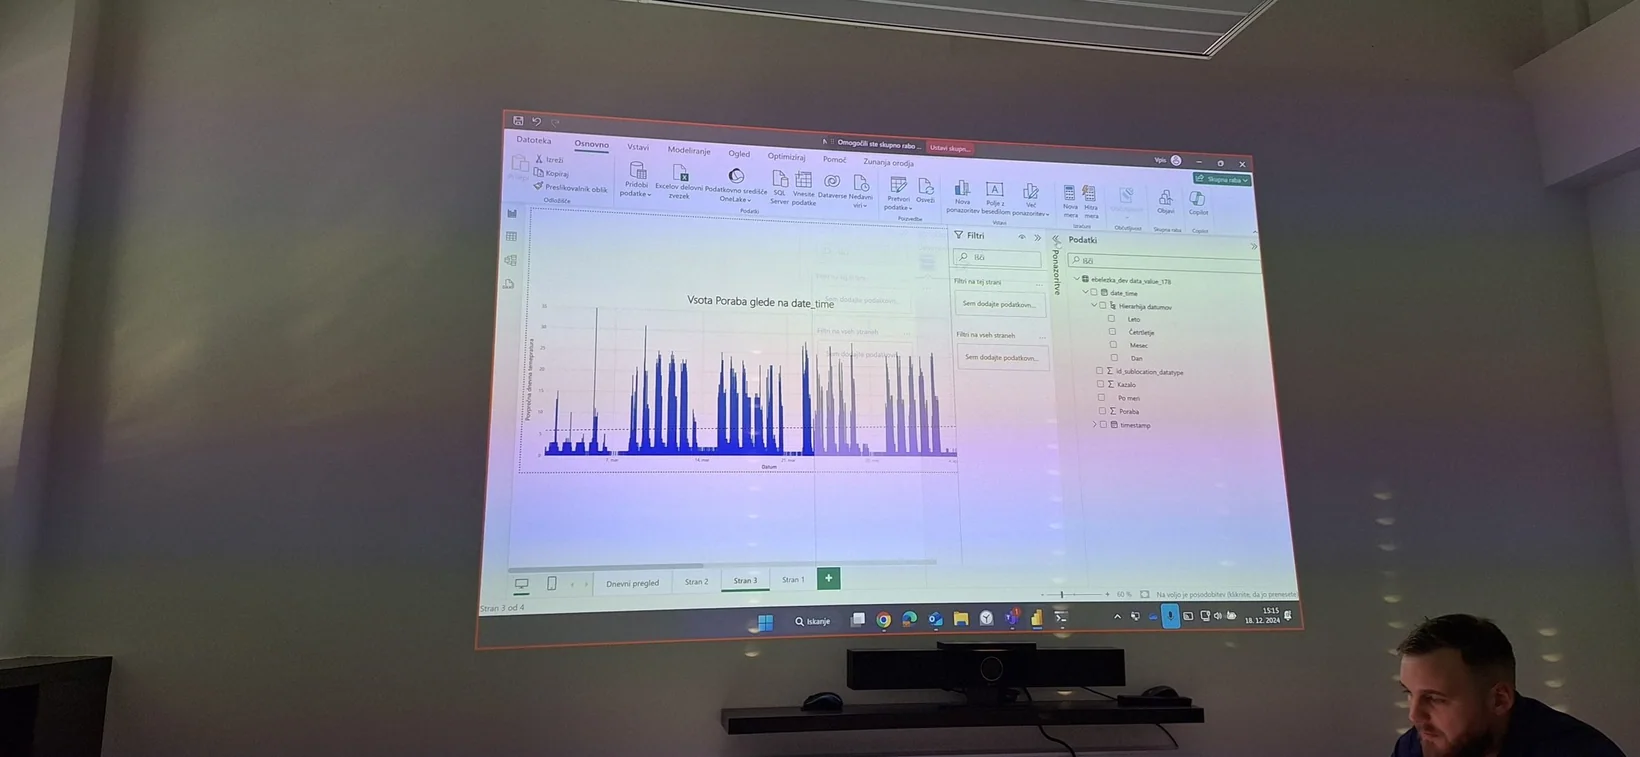
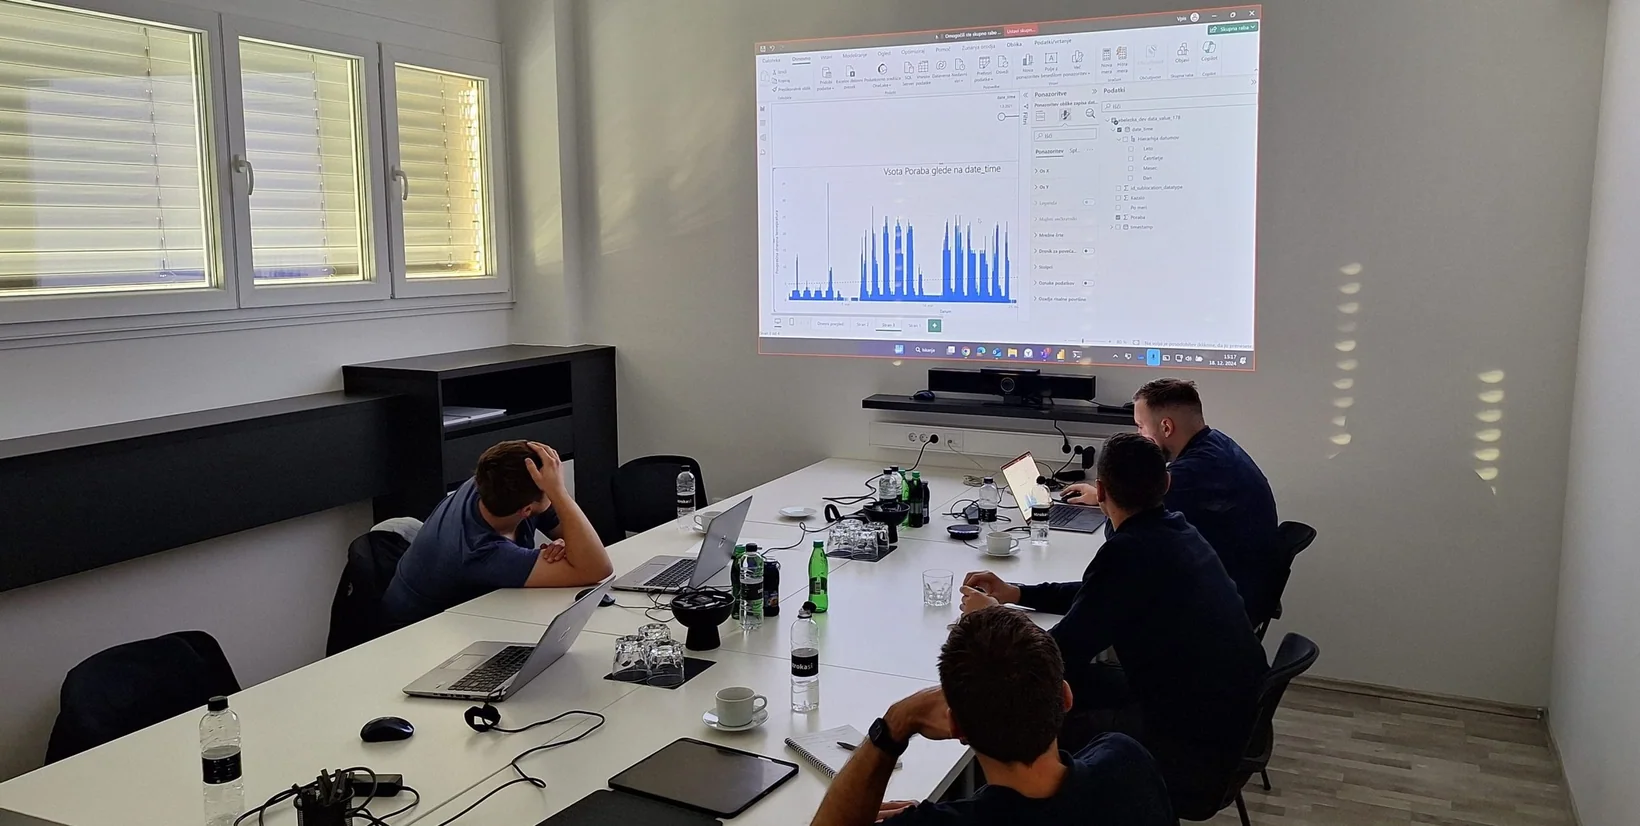
An example of how to use a gallery in a test news item.
For further context, a WJE video on building airtightness testing has been included.
The attached PDF contains a checklist for editorial review. It does not contain any project details.